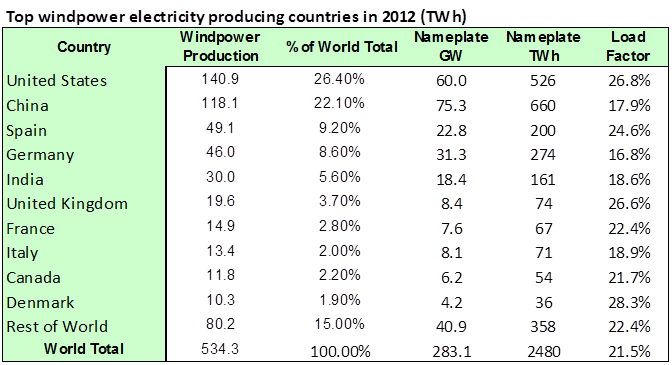
Blog

EIA 2040 Forecast

May 29, 2016

The Center for Strategic and International Studies published its International Energy Outlook 2016 on May 11, 2016.

A reference to the www.eia.gov follows the tag line “Independent Statistics & Analysis”. I’m all for that! What’s not to like?

What is fascinating about this report is that it actually makes a forecast out to 2040. Most forecasts done to date stop at 2030, a date corresponding to the new Clean Power Plan (CPP) and other advertised Climate Change initiatives.

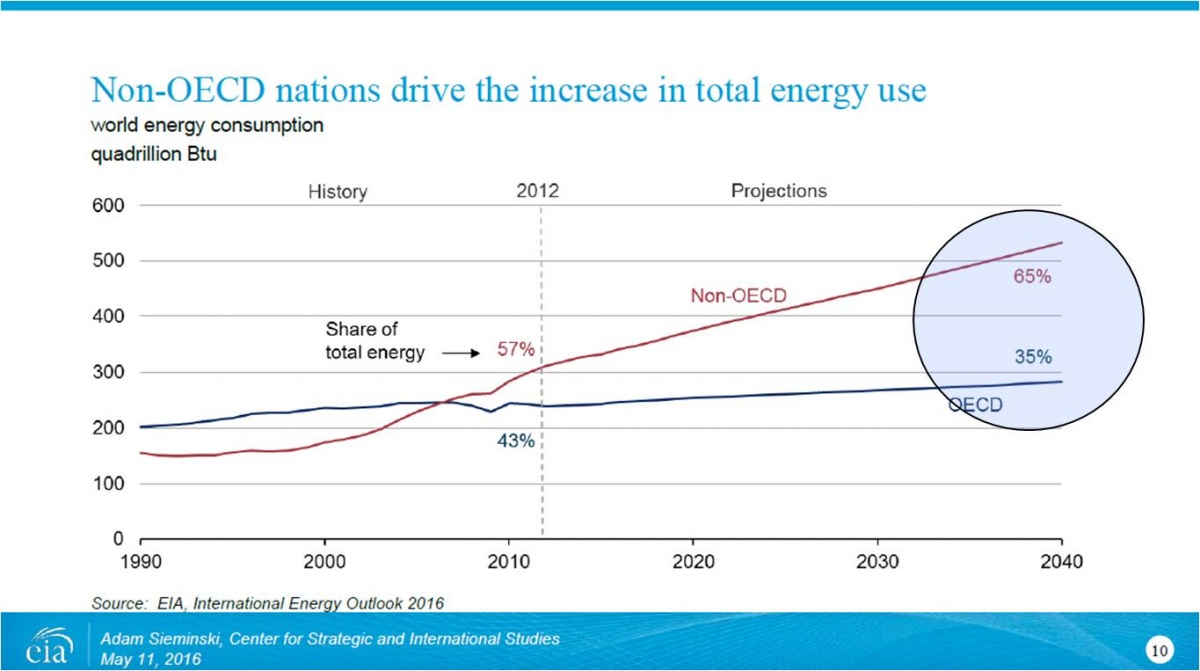
The report breaks down energy use between OECD and Non-OECD countries 35%/65%, as can be seen in the chart, shown below. The comment identifies most of the increased energy use in the Non-OECD countries.

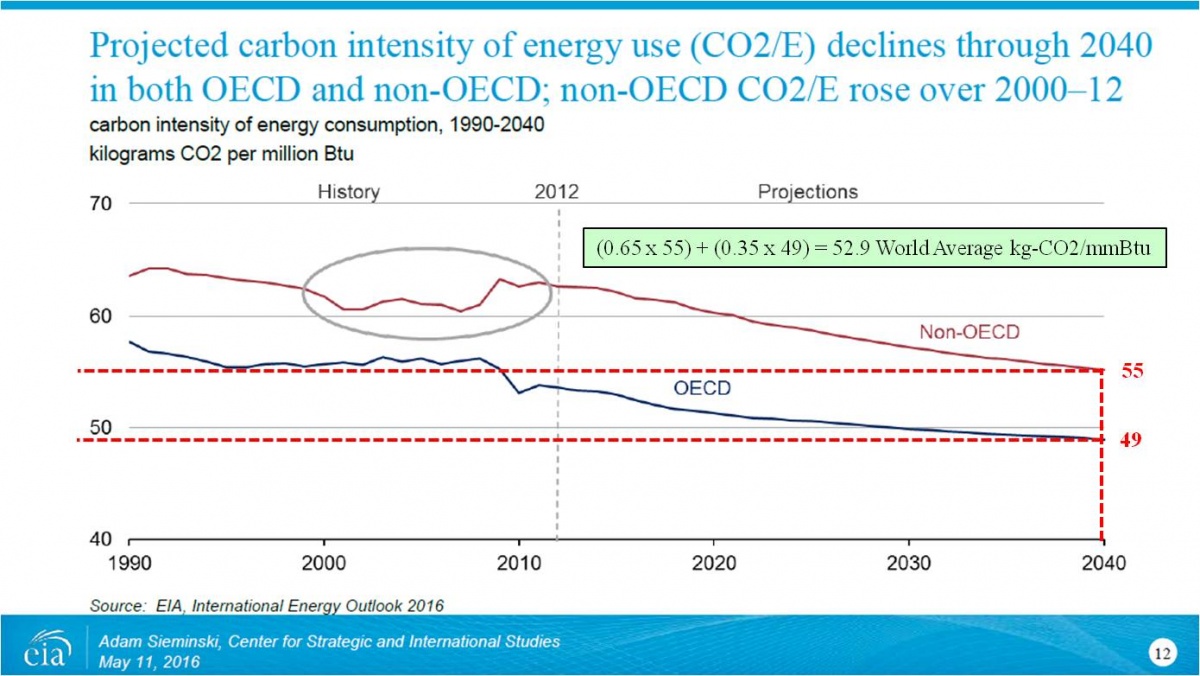
The report further breaks down the energy related CO2e intensity of energy use, expressed in kilograms CO2 per million Btu, again, between OECD and Non-OECD countries. Those values are 49 kg-CO2/mmBtu for the OECD and 55kg-CO2/mmBtu, respectively and as indicated on the chart below.

The weighted average intensity is 52.9 kg-CO2/mmBtu.

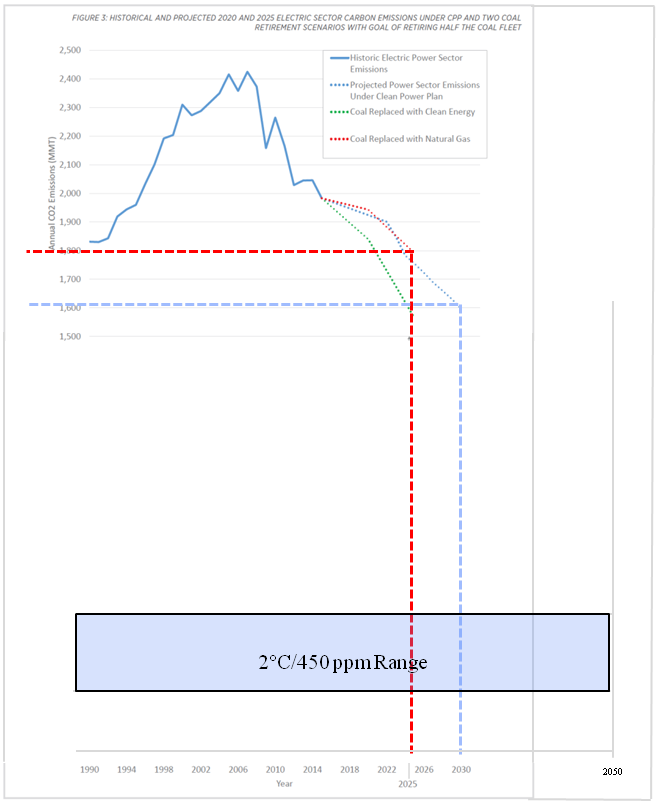
The interesting part of this report is that, unlike others, the forecast includes projections to 2040, with the impact of the new Clean Power Plan.

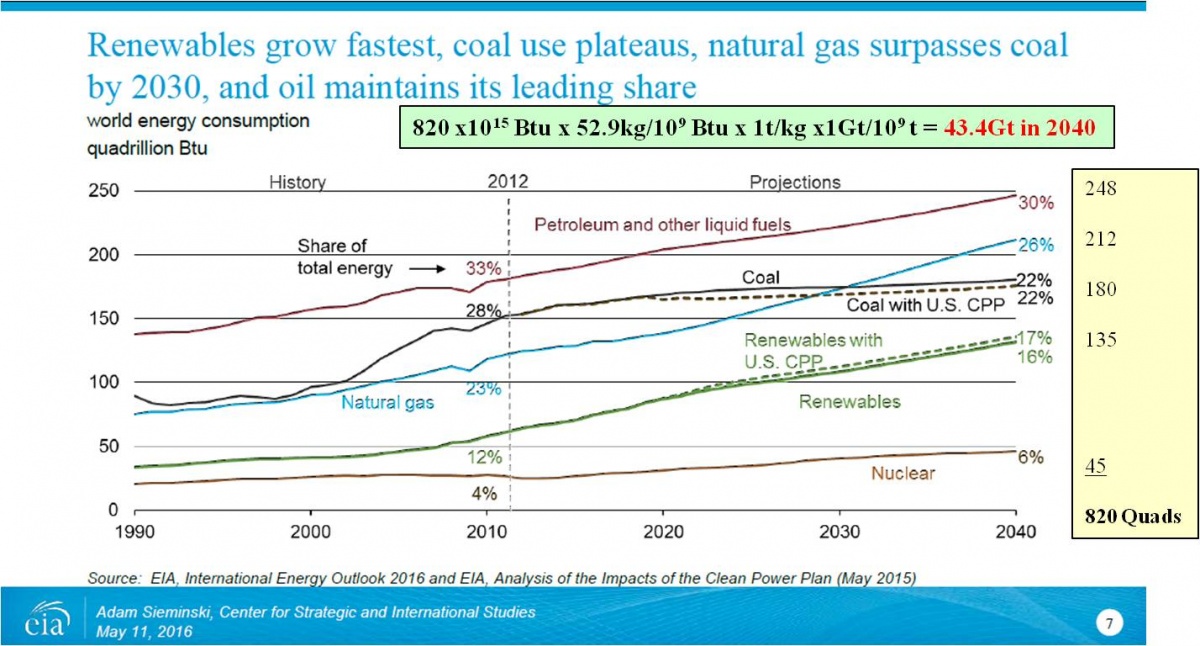
I have “eye-balled” these charts and have estimated this is 820 Quad, which at 52.9 kg-CO2/mmBtu is 43.4Gt of CO2 from the energy sector. The report says 43 and 815 Quads.

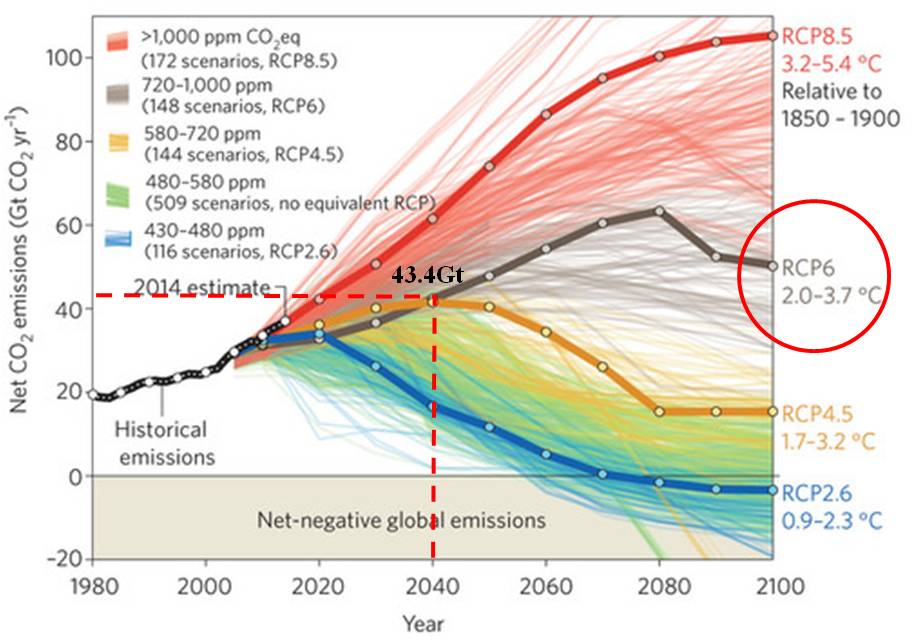
I plotted this forecast value on the previously published chart of scenarios from the Intergovernmental Panel on Climate Change (IPCC) AR5 review, shown below.

The summary conclusions in the report state that 75% of energy use in 2040 will come from fossil fuel.

The unavoidable conclusions are:

  • The world is not even close to where it needs to be on prevention
  • We are on an increasing trajectory and headed toward 4°C, if we are lucky
  • The CPP contribution is minimal and only affects Coal
  • Natural Gas generation is unaffected by CPP, since it has a waiver on its “½ of Coal” emissions
  • We are not yet being honest with ourselves
  • President Obama does not know this

The EIA presentation is available here:

https://www.eia.gov/pressroom/presentations/sieminski_05112016.pdf

“Mission Accomplished?”

May 16, 2016

That would depend on how the “mission” is defined…right?

The Sierra Club published a Fact Sheet dated November 3, 2015, “Accelerating the U.S. Coal Phase Out: Leading by Example in Paris and Beyond”, in preparation for the COP21 conference.

Their Figure 1, shown below, offers a summary view of the progress to date for both the Electric Power Sector and the U.S. in total.

Their Figure 3, below, indicates the Electric Power Sector contribution along with several important future scenarios. The graph and the paper itself, provide important understandings, insights on the projections and their associated assumptions. I have added the vertical lines to pick off data for the various referenced dates.

The actual write-up offers further information on assumptions, as well as a few specific values for these scenarios. I have used those values, where available, to tabulate the data. The U.S. totals are also shown, if electric power generation is 38.5% of the total.

The scenarios and their end-point values are:

  • -Coal Replaced with Natural Gas at 1790Mt in 2025
  • -Projected Electric Power Sector Emissions under the Clean Power Plan at 1600Mt in 2030
  • -Coal replaced with Clean Energy at 1563Mt in 2025

The Sierra Club has defined its mission in their “Beyond Coal” initiative, but their actions and words suggest the mission to be “Killing Coal”. They make a point of their success in the document with their Figure 2, below.

But, shouldn’t the mission be “Killing the Emissions from Coal (& Gas)”? Or, even more appropriately, something like “Achieving 2°C/450ppm by 2050”? 

The 2°C/450ppm trajectory at 16Gt world total requires a total U.S. emissions level of 1.3Gt (1300Mt) in 2050. The Electric Power Sector portion of that at 38.5% is 500Mt, assuming balanced contribution. If a balanced contribution proves too difficult, as is likely, the Electric Power Sector may have to reach 200Mt.

Why is this so-called “...Leading by Example…” document silent on actions beyond 2030 and below 1500Mt?

If anything, I find the Sierra Club position to be “misleading” and very much in service of their mission of “killing coal”, but not our mission of dealing with Climate Change. The combination of fuel switching and a further shift to renewables, alone, will not put the world on a trajectory to reach 2°C/450ppm.

I have said this before, but it is worth repeating.

If we all had the same “objective”, we would use the current lower cost of natural gas to offset the added cost of CCS, put CCS on Natural Gas Combined Cycle power plants, and in so doing, actually be on the CCS learning curve and be on the 2C°/450ppm trajectory.

The current course of action will likely waste time that we simply do not have.

You can find their fact sheet here:

https://www.sierraclub.org/sites/www.sierraclub.org/files/BeyondCoal-Paris15_Factsheet.pdf

Competition Under the 2015 EPA Clean Power Plan

Nov 21, 2015

Under the new Clean Power Plan, the EPA calculates state goals based on the Best System of Emission Reduction (BSER), and has now established separate emissions performance rates for coal and natural gas plants, as follows:

  • An interim emissions rate for existing coal units of 1,534 lbs CO2 per Net MWh, and a final rate of 1,305 lbs-CO2 per Net MWh
  • An interim emissions rate for existing natural gas units of 832 lbs CO2 per Net MWh and the final rate of 771 lbs-CO2 per Net MWh

The following table has been modified from the original 2014 version to calculate the Advanced-USCPC CO2 emissions based on a 50% LHV value with the 203.3 lb-CO2/mmBtu carbon factor. The NGCC values are shown, as before.

The Natural Gas Combined Cycle (NGCC) power plant meets the 832 lb-CO2/MWh interim level now, and the final 771 level without any form of CO2 abatement, if expected efficiency gains are realized.

The graphic shown below was developed as part of an International Energy Agency “Road Mapping” exercise toward a High-Efficiency, Low-Emissions (HELE) coal fired power plant, shown as an Advanced Ultra-Supercritical Pulverized Coal (Advanced-USCPC).

The graphic indicates that at 50% LHV efficiency, the CO2 emissions would be ~1477 lb-CO2/MWh (~670 gCO2/kWh).

The Advanced Ultra Supercritical Pulverized Coal Plant(USCPC) at 1540 lb-CO2/MWh, would appear to meet the interim full load threshold level of 1534 lb-CO2/MWh, but another 15% efficiency improvement would be required to meet the final threshold of 1305 lb-CO2/MWh. Either that, or 15% Carbon Capture would be required.

In the most optimistic scenario, these new thresholds would position a NGCC without abatement against the Advanced-USCPC, also without abatement.

There are no first cost estimates for the Advanced-USCPC, but its lower efficiency predecessor was at least 3x the first cost. The efficiency, defined above, favors the NGCC. It should be noted that this comparison assumes significant efficiency improvement in both the NGCC and the Advanced-USCPC. Industry experience to date suggests that gas turbine concepts are much more likely to realize these efficiency improvements than coal-based efforts, and to reach them sooner.

The fuel cost differences are also narrowing, as shown in the following data extracted from the Energy Information Agency’s August 2015 year-over-year comparison, reducing coal’s historical price per mmBtu advantage.

At a nominal 550MW, the annual fuel cost difference is $23 million per year, in favor of the Advanced-USC, requiring a 40-year simple payback on the ̴$1.0 billion first cost difference.

If the differences in CO2 emissions were added at $60/Mt, the combined fuel and CO2 operating costs would shift in favor of the NGCC at $30 million per year.

The breakeven point would be about $25/Mt of CO2 at the fuel and efficiency rates.

A couple of things are happening here:

  • This dual standard concession is the result of the successful coal industry challenge on whether CCS was a “commercially available” technology. The EPA is prohibited from mandating a technology that is not “commercially available”.
  • The EPA is pandering to the coal industry by giving them their own standard and more importantly, the opening to dismiss CCS as a laboratory-level R&D level technology in hopes of building coal plants without CO2 abatement.
  • Natural Gas Combined Cycle Power Plants will continue to be built without doing anything about CO2 emissions. This has been the EPA’s primary objective throughout and that objective remains intact. This is Business as Usual dressed up to look like climate action.
  • In so doing, this EPA has, once again, chosen not to support CCS technology development, acknowledged to be part of any 2°C/450 ppm target.
  • CCS has been “kicked down the road” until 2030, at a minimum, when we “finally” realize that deploying CCS on NGCC plants is required to reach at 2°C/450 ppm level. We know that now! We are just wasting 15-years that we will wish we had. Mother Nature does not allow “do-overs”.
  • This is a recognition that we are on 4°C/720-1000 ppm trajectory, and that seems to be OK!
  • ……Really?

OBTW….It should be noted that CO2 that comes from a coal plant is the same as the CO2 that comes from a gas plant. The original standard was correct in that the threshold(s) was independent of source.

In the end, it is just CO2!

Competition under the EPA Clean Power Plan.pdf

Renewable Energy System Integration Costs

Nov 21, 2015

The “Tragedy of the Commons” is an economic theory first authored by Garrett Hardin. It states that individuals acting independently and rationally according to their own self-interest, behave contrary to the best interests of the group as a whole, by depleting some common resource.

We normally think of the “Commons” in conjunction with Climate Change in general or depletion of the ocean’s fish stocks, but the “Commons" in the case of Variable Resource Energy (VRE), such as wind and solar, is the grid that provides essential integration support necessary to their success.

John Thompson, at the time, Director of the Fossil Energy Transition Project for Clean Air Task Force, made a presentation at the Pittsburgh Carbon Capture & Sequestration Conference in April 2014. The topic was System Integration as related to renewables.

The original work was authored and presented Ueckerdt, Falko and Hirth, Lion and Luderer, Gunnar and Edenhofer, Ottmar, System LCOE: What are the Costs of Variable Renewables? (January 14, 2013). Available at SSRN: http://ssrn.com/abstract=2200572 or http://dx.doi.org/10.2139/ssrn.2200572

The following graphic from that paper illustrates the key take-away and integration cost components.

Highlights as published in the paper:

  • A proposed new metric, System LCOE, that includes both generation and integration costs be used to determine the economic comparative costs of wind and solar power
  • Integration costs of wind power can be in the same range as generation costs at moderate shares (~20%).
  • Integration costs can become an economic barrier to deploying Variable Renewable Resources (VRE) at high shares.
  • A significant driver of integration costs is the reduced utilization of capital-intensive,conventional plants.
  • An economic evaluation of wind and solar power must not neglect integration costs.

At the moment, integration costs are an afterthought and borne by the utility infrastructure. As with any “Commons”, there will come a day when the resource can no longer be sustained.

These effects are both complicated and amplified by the various state level Renewable Portfolio Standards (RPS) and the Production Tax Credits (PTC) currently in force or pending.

Renewable Energy System Integration Costs.pdf

Wind Load Factor

Sep 23, 2015

I love Wind!

Wind is good, anytime…anywhere! I like how they look and I like what they do.

But, have you ever noticed that all the success claims relate to how much wind capacity has been installed, rather than how much power that has been generated.

To illustrate, here’s some recent data on installed capacity:

There is some information available on wind energy penetration into the overall electricity consumption. As can be seen from the chart shown below, the U.S., as a point of comparison indicates that wind accounted for just under 5% of electricity consumption in 2013, an approximate 4x increase over 2006.

In terms of Climate Change impact and specifically in terms of the CO2 emissions profile, load factor is more interesting.Wikipedia provides some wind data by country, tabulated below.

The data suggests that load factors typically vary between 20% and 30%.No surprise here.Most of these wind projects tend to be driven by first cost and today these wind assets are backed-up by natural gas-fired, simple-cycle gas turbines to manage the intermittent wind resource. These types of simple cycle units are required by the EPA New Source Performance Standard to not exceed 1100 lb-CO2/MWh.

The combined effect of 30% at zero lb-CO2/MWh, plus 70% at 1100 lb-CO2/MWh, would deliver 770 lb-CO2/MWh in the best case, but some of these simple cycle units operating at part or varying load struggle to meet 1100 lb-CO2/MWh and at a 20% load factor, that combination would yield a value closer to the combined cycle CO2 threshold without abatement of 1000 lb-CO2/MWh.

Wind Load Factor.pdf