Blog

The 2017 EIA Annual Energy Outlook - "5°C or 6°C?"

Jan 22, 2017

The 2017 Annual Energy Outlook, released in early January, provides a CO2 emissions forecast, which includes a base Reference Case along with side cases that examine the forecast sensitivity to six basic assumptions.

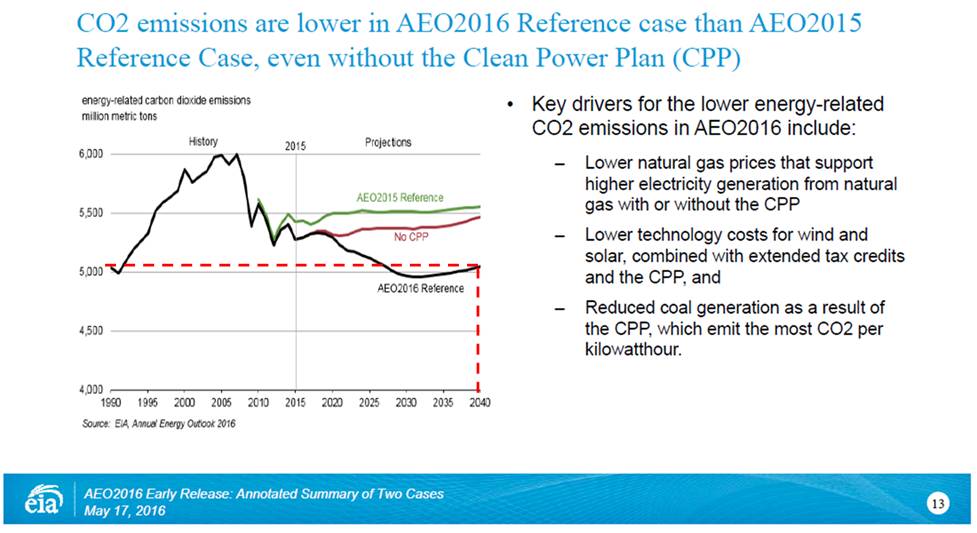
The Reference Case assumes that the U.S. implements the Clean Power Plan (CPP).

The six side case variations are:

  • High & Low Economic Growth
  • High & Low Oil Price
  • High & Low Oil & Gas Resource & Technology

In addition, the EIA has also provided a forecast for the Reference Case that assumes the U.S. does NOT implement the Clean Power Plan.

The report generator provides both a U.S. Electric Power and a U.S. Energy-Related Forecast. The report generator is available through a link on its website (http://www.eia.gov/outlooks/aeo/data/browser/).The report generator does not allow the user to combine the effects of these side cases.

There are eight cases in all. I have found it useful to arrange these case results from the U.S. Energy Related Total, high to low, to get a sense of their relative impact.

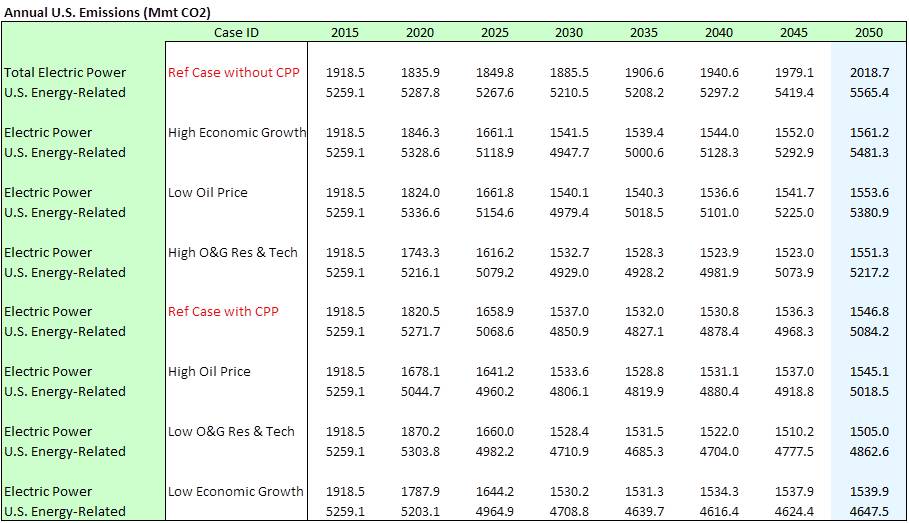
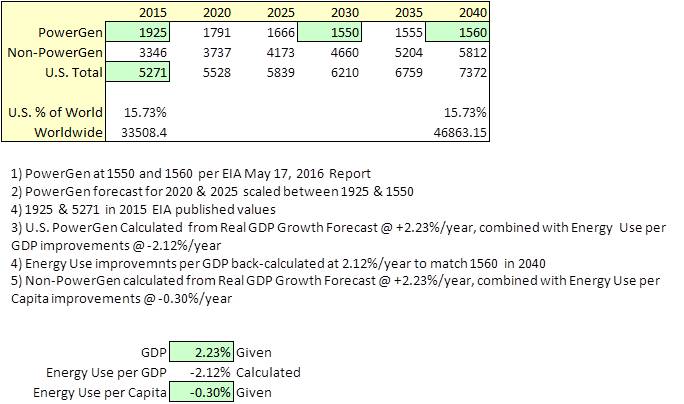
Note, that there is hardly any difference in Electric Power CO2 emissions except in the Reference Case without CPP. All the other cases are in the 1550 Mmt range and there is hardly any impact beyond 2030. This is largely the result of the underlying generation mix assumptions of 70% NGCC without CCS, in combination with 30% renewables, and that the conversion from coal to NGCC is virtually complete by 2030.

The impact of the CPP is shown below, and is in keeping with the approximately 400 Mmt (0.4 Gt) in the AEO2016 edition forecast for 2040.

Given the new direction articulated by the incoming Trump administration, a new “worst case” needs to be defined. The prevailing rhetoric would suggest a scenario as follows:

  • No CPP ( x1.305 & 1.095)
  • High Economic Growth (x1.009 & 1.078)
  • Low Oil Price (x1.004 & 1.058)
  • High Oil & Gas Resource & Technology (x1.003 & 1.026)

The values shown are the Electric Power and Energy Related values, respectively, compared to the reference case with CPP.

The combined effects of these in 2050 are x1.327 & x1.282 respectively, again, compared to the Reference Case (with CPP). If these factors are applied in combination, the resulting 2050 U.S. Electric Power Emissions are 2052.4 Mmt, and the Energy-Related Emissions are 6516.3 Mmt (6.5 Gt), effectively the same emissions we have today.

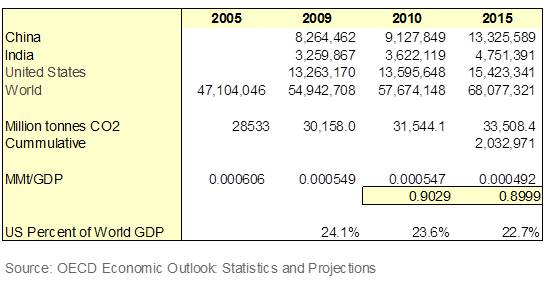
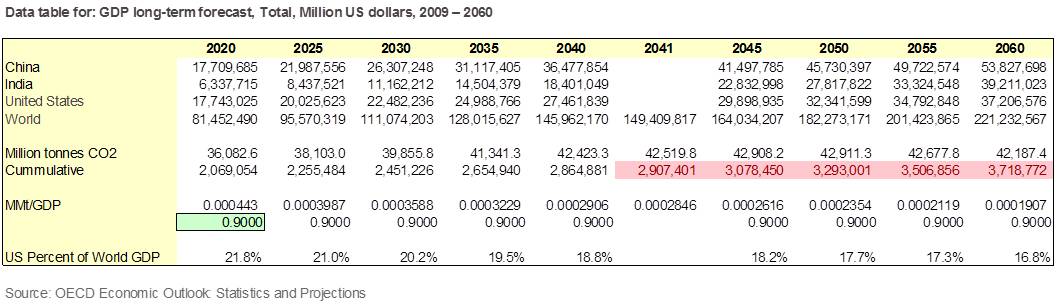
The Worldwide CO2 emissions, based on the AEO2016 are shown in the following table, along with a calculated U.S. percent contribution.I have extrapolated the 2050 U.S. Energy-Related Emissions without CPP to the estimated 11.4% of the total. Should that remain the case, this set of combined assumptions results in a Worldwide Emission total of 57.0 Gt.

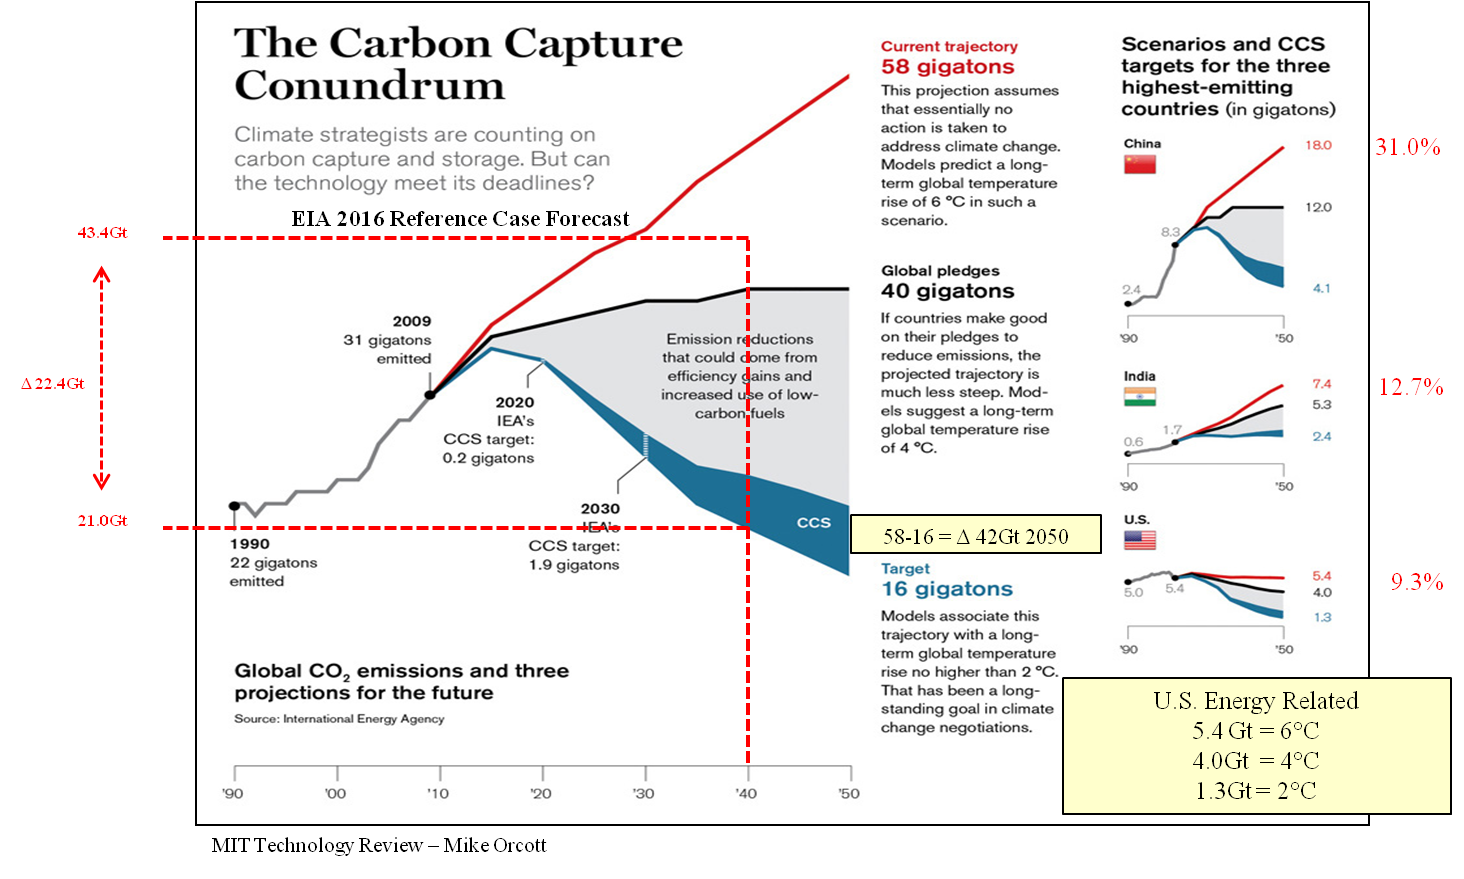
The 57.0 Gt puts the world on a 6°C trajectory. I’ll leave you locate this on the Carbon Capture Conundrum plot. Hint…it is 3x the 2°C target and 4x the 1.5°C target.

The U.S. portion of the 6°C, 58 Gt Worldwide emissions in 2050 is 5.4 Gt, vs. the projected 6.5 Gt with combined effects as noted above.

If the same logic were applied to the Reference Case (with CPP), the 5084.2 U.S. Energy-Related CO2 emissions would become 48.8 Gt Worldwide, at approximately 5°C.

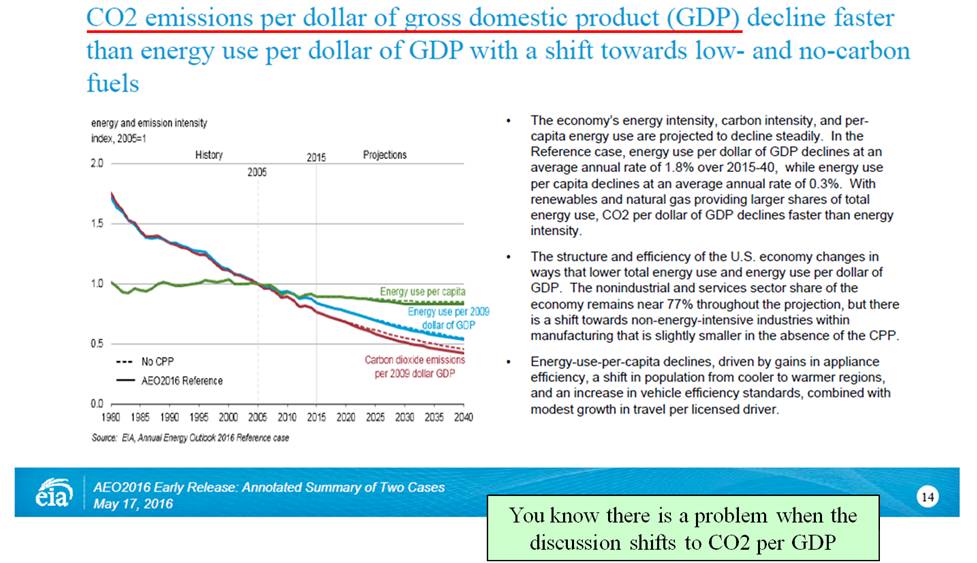
The AEO2017 also offers a metric of mt per Capita, presumably to support the claim that emissions are declining. We have seen this logic attempted before, either as CO2 tonnes/GDP or some other production index. CO2 per Capita is just another surrogate for these output-based measures that allow emissions to grow along with economic output.

The good news is that this output-based logic is similar to those proposed by China and India. The bad news is that we are nowhere close to the level required to reach the 2°C/450ppm goal.

Finding the Middle Ground Between Coal and Climate Change

Nov 30, 2016

Huntley coal-fired power plant in Tonawanda, New York

At some point, the country will need to find the middle ground between "The War on Coal" and the imperatives of "Climate Change". I have spent the last 12 years on the inside of this Power Plant/Climate Change debate. Here is my take:

Coal is not competitive because of the EPA New Source Performance Standards (NSPS), first issued in 2014. The NSPS mandated that coal-fired power plants deploy Carbon Capture (CCS), but allowed natural gas power plants to be permitted without doing anything. This was not done explicitly, but by setting the new power plant emissions limits at a level that the natural gas plant could meet “unabated”. This was a “Business as Usual” for the natural gas team.

Under this scenario, the coal plant was 5x the first cost and half the efficiency. This is the War on Coal. The EPA is aware of all this, their efforts were intentional and were supported by The Sierra Club, itself funded by the gas industry. It suited the EPA’s own hidden agenda as well. The EPA did not want to capture CO2 because it has no plan to deal with CO2, if it were to be captured.

On top of that, the gas price dropped precipitously. Some like to deflect their regulatory role and simply blame the gas price for the coal industry demise. It was the regulation first, then compounded by the fall in natural gas cost.

The "coal guys" first tried to make it all go away, but without success. They then lobbied for their own standard and EPA was happy to oblige in 2015 with a NSPS modification in 2015. The change did not materially affect the competitive positioning of the two offerings. Coal was still over 3x the first cost and had a 30% efficiency penalty.

Neither of these EPA standards mentions Climate Change or climate targets.

The Energy Information Agency baseline scenario models the build out an entire fleet of natural gas units without abatement and implementation of the Clean Power Plan. That scenario forecasts the U.S. to emit 5044 Mmt/year of CO2 in 2040. The U.S. CO2 budget for a 2°C target is 1300Mmt in 2050. The current trajectory with full implementation of the CPP is more than 3x the target. At the same time, we will have reached the impact limit of fuel switching from coal to gas.

Virtually all of the IPCC scenarios that suggest a 2°C/450ppm could be achieved include both Carbon Capture (CCS) and Nuclear. CCS is currently on “life support” and most of the nuclear projects have been shelved. They too cannot compete with the unfair competitive advantage of unabated natural gas. This is also the reason nuclear plants are being shut down, rather than being upgraded and relicensed to extend their life.

CCS is the key to giving both the Coal Industry a fair shot, and the world in meeting any reasonable climate goals, but only if applied equally and to all types of power plants. You cannot force coal to capture, while giving gas a free pass. CO2 is CO2. There is no such thing as clean CO2.

It is essential to require both coal and natural gas power plants deploy CCS to reach 250-300 lb-CO2/MWh. If done, we could be on 2°C/450ppm trajectory and the CCS learning curve.We would use the lower natural gas price to offset added cost of CCS, so as not to penalize end users.

Eliminating CO2 from the electric power generation is also the critical enabler to realizing the impact of electric vehicles.

We all agree that a value must be put on CO2, so that it can affect investment choices.

Cap and Trade is one method, but it has two components. The trade is easy. The cap is political, given to influence peddling, etc. Politicians have already proven that they cannot effectively handle that responsibility with anything like a timely and fair implementation.

“Revenue Neutral” tax and rebate/dividend schemes have been proposed. The tax is ok, but why give the money back? Use the money to solve the problem!

Solutions?

My favorite is to implement a “CO2 (waste) Disposal Fee” based on a calculable cost to dispose of it. I would use those funds to build pipelines to pre-permitted, remote underground locations for storage in perpetuity. The Federal Government would need to assume long-term liability.

Note….This entire effort would fit neatly into any infrastructure build-out and rural jobs program.

We also need to buy land and plant trees, as well as invest in mass transit.

Earth to China

Nov 21, 2016

I need you!

My, thought to be, principal advocate and benefactor has just shot itself in the foot and I am likely to become collateral damage, big time!

I need you to step forward and take the lead on today's important Climate Change imperatives, now cast aside by the (not so) United States of America.

You and you alone can help me.

You certainly have the money and the need, and you do seem to understand the problem. You also know how to get things done and are largely unencumbered by the interveners.

Please set the example, take the lead and turn this problem into a giant export opportunity.

Your friend,

Earth

Disingenuous - (and, not the least bit surprising)

Sep 10, 2016

SNL published an article entitled “As gas tops coal for carbon emissions, Sierra Club sees next climate fight”, based on an interview with Lena Moffitt. The article was written by Annalee Grant on August 18, 2016 and can be found on the internet (https://www.snl.com).

The article included some of the familiar EIA data and charts as follows:

According to SNL, the Sierra Club just acknowledged that…

"As we're trying to meet our climate goals, it is very clear that we cannot afford to expand infrastructure and reliance on fossil fuels, including gas."

Other reported comments and observations included:

"In 2015, natural gas consumption was 81% higher than coal consumption, and their emissions were nearly equal. Both fuels were associated with about 1.5 billion metric tons of energy-related CO2 emissions in the United States in 2015," the EIA report said.

"In addition to this being a significant wake-up call for hopefully all Americans, it's also a real indication of where the next climate fight is going to be and that really is with gas"

"As we're trying to meet our climate goals, it is very clear that we cannot afford to expand infrastructure and reliance on fossil fuels, including gas."

"It's incredibly encouraging that our country has been able to move away from coal in the way that it has, and that's a trend that we want to see of course for the climate benefits and the public health benefits"

"At the same time, we do need to ensure that that energy is not backfilled with gas."

"Unfortunately, the theory that gas can provide an energy bridge has stuck around too long, and is frankly just not true."

"If you take the full life cycle view, gas could be just as bad for the climate as coal."

The extraction of natural gas is also responsible for methane emissions, which the EPA has said has a climate change impact 25 times greater than carbon over a 100-year period.

Further EIA research anticipates a 55% increase in gas extraction and a 24% hike in gas consumption by 2040, according to Moffitt, who expressed concern that the expansion could push the U.S. well over the greenhouse gas reductions pledged in Paris in December.

"Just that consumption alone, if you consider the methane emissions, will cause us to blow past our international climate goals, which is unacceptable if we want to keep this planet in a livable state."

She worries that reducing coal in favor of gas could mean trading one greenhouse gas for another.

Looking more closely at coal- and natural gas-fired power generation, coal remains the top emitter of carbon, although those emissions are trending downward as coal capacity shrinks.

Carbon emissions from natural gas generation have risen moderately, as more gas capacity has been added, but coal in 2015 still exceeded natural gas by 904 million tons of emitted carbon, according to SNL Energy data.

The Sierra Club will respond by doubling down on efforts to both fight investments in gas and prioritize renewables and energy efficiency.

SNL observed that, “News of rising carbon emissions from gas consumption was greeted with dismay by the Sierra Club, which has maintained a major campaign against coal-fired generation. The group has also lobbied against the expansion of natural gas infrastructure, and Beyond Dirty Fuels Campaign Director Lena Moffitt said the EIA data underscores the importance of that fight.”

This is the data behind the first EIA chart. To be clear, the ~100 Quad includes all energy-related use.

A more detailed and fascinating breakdown of that ~100 Quad U.S. Energy Consumption is available from the Lawrence Livermore National Laboratory (LLNL).

The energy-related terminology in these data encompasses the natural gas consumption at 27.27 Quads from the data table, or 28.3 Quads from the LLNL chart, with the pathways as shown.

Natural gas consumption for Power Generation was 9.99 Quads in 2015.

The efficiency of the primary energy conversions, shown as percentages in red (black for Electricity Generation) are:

  • Electricity generation (all fuels)  - 33.0%
  • Residential - 64.9%
  • Commercial - 65.0%
  • Industrial - 80.0%
  • Transportation - 21.0%

The two areas with the greatest opportunity improvement in overall efficiency of energy use are the power sector and transportation sectors. Both of these will increase the role of and pressure on CO2 emitted for electricity production.

It is completely disingenuous, but at the same time, not the least bit surprising for the Sierra Club to cite the new EPA Methane Rule, yet remain completely silent on the emissions from natural gas fired power plants.

The CO2 emissions for power generation were 1891.3 Million metric tonnes (1.891 Gt) in 2015. Natural gas power generation accounted for 524 Mmt (0.524 Gt), or 27.7% of the total.

The May 12, 2016 EPA Final Ruling to Reduce Emission from the Oil & Gas Industry, which they do allude to, has a stated goal of reducing emission by 40-45% from 2012 levels, by 2025. The rule is intended to capture 510,000 short tons of methane, with the equivalent of 11 Million metric tonnes of CO2 (0.011Gt).

Carbon Capture is not now, nor has it ever been in the EIA or the Sierra Club narrative. Successful deployment of Carbon Capture and Storage (CCS) would serve to enable coal. Such an outcome would be intolerable for Sierra Club, which is why they ignore its potential deployment. CCS is the real “Bridge”, not natural gas as has been claimed.

The EIA Reference Case forecasts data is shown below indicating 653 Million metric tonnes (.653 Gt), of CO2 from natural gas fired power plants in 2040, dwarfing the impact of methane leakage.

The forecast includes a 45% increase in power from natural gas, but only indicates only 24% increase in CO2 emissions, with natural gas accounting for 35.9% of the supply.

The 2015 and 2040 specific output values expressed in lb-CO2/MWh are easily calculated:

Natural Gas 2015: 524.5 Mmt x 2205 lbs/tonne/1113.7 BkWh = 1038 lb-CO2/MWh

Natural Gas 2040: 653.0 Mmt x 2205 lbs/tonne/1617.9 BkWh = 890 lb-CO2/MWh

Coal 2015: 1340.2 Mmt x 2205 lbs/tonne/ 1319.9 BkWh = 2239 lb-CO2/MWh

Coal 2040: 885.0 Mmt x 2205 lbs/tonne/ 884.3 BkWh = 2207 lb-CO2/MWh

These 2040 values are consistent with unabated coal-fired power plants at 2200 lb-CO2/MWh and indicate only a 1.5% improvement in the 2015 rate.

The natural gas combined and simple cycle units, also unabated at 890 lb-CO2/MWh, do include a 15% reduction in CO2 per MWh, presumably the result of a shift in the mix toward the more efficient combined cycle configurations. The 890 lb-CO2/MWh for natural gas in 2040 would represent a mix of approximately 70% combined cycle and 30% simple cycle units.

If CCS were to be applied at 90% capture, the 1551 Mmt is value would become 155 Mmt and the resulting U.S. total would become 4900 Mmt (4.9 Gt).

It should be noted that the 1551 Mmt CO2 emission for electric power is 3-8 times the 200-500 level required to reach the 2°C 450 ppmv goal. We will need CCS on both coal and gas to reach this level.

The U.S. “target”, if there is such a thing, is 1.3 Gt. These data suggest that we are closer to a 4 or 5°C trajectory.

I have said this before, but it is worth repeating:

If we all had the same “objective”, we would use the current lower cost of natural gas to offset the added cost of CCS, put CCS on Natural Gas Combined Cycle power plants and in so doing, actually be on the CCS learning curve and the 2C°/450ppm trajectory.

The EIA just said that Clean Power Plan is not good enough!

Jul 03, 2016

        Of course, they did not say it that way, exactly, but here is what they did say.

        The Center for Strategic and International Studies published its International Energy Outlook 2016 on May 11, 2016. I commented that this report which, unlike others, included projections to 2040 and the impact of the new EPA Clean Power Plan.

        The summary’s conclusions state that 75% of energy use in 2040 will come from fossil fuel and that the forecast for worldwide power generation CO2 emissions was 43.4Gt, up from 33.5Gt in 2015, a compound growth rate of +1% per year. I commented on this forecast in my previous blog. (http://www.base-e.net/blog-12-eia-2040-forecast).

        This May 11 report was quickly appended with the May 17 Annual Energy Outlook 2016 Early Release of an Annotated Summary of Two Cases (https://www.eia.gov/forecasts/aeo/er/pdf/0383er(2016).pdf).

        The two early release cases and stated conclusions are:

        Implementation of the Clean Power Plan (CPP) using a mass-based approach reduces annual electricity-related carbon dioxide (CO2) emissions to between 1,550 and 1,560 million metric tons (MMT) in the 2030-40 period, substantially below their 2005 and 2015 levels of 2,416MMt and 1,891MMt, respectively. Coal’s share of total electricity generation, which was 50% in 2005 and 33% in 2015, falls to 21% in 2030 and to 18% in 2040.

        Even without the CPP, electricity-related CO2 emissions remain well below their 2005 level at 1,942 MMT in 2030 and 1,959 MMT in 2040; this outcome reflects both low load growth and generation mix changes driven by the extension of key renewable tax credits, reduced solar photovoltaic (PV) capital costs, and low natural gas prices.

        Several observations on these projections:

        • They just admitted that a full implementation of the CPP will not allow us to reach a 2C/450ppm target.
        • The coal to gas conversion is 82% completed by 2040.
        • There is only 400 MMt (0.400Gt) difference between the full implementation of the CPP and No-CPP case.
        • The total U.S. CO2 emissions in 2015 were 5721 MMt, split 1925/3346 MMt PowerGen and Non-PowerGen, respectively.
        • The forecast asks that you believe that natural gas prices will trend even lower than they are today, through 2040.
        • It also asks that you ignore system integration costs, not yet fully considered in the renewables claims about cost competitiveness.
        • In addition, it asks that various tax credits be extended throughout the forecast period while both Germany and Denmark are just now putting caps on renewables penetration.

Here are the two cases and the assumptions they are based on.

        The actual numbers provided suggest to that this improvement in use efficiency is more like 2.12% per year. In other words, efficiency of use will offset any Real GDP increases.

        There is no real discussion of the Non-PowerGen values, except a decline of 0.3% in Energy per Capita Use. I have assumed this is a similar offset against the 2.23% per year Real GDP growth, which presumably affects the Non-PowerGen values.

        This is my attempt at reconciling the comments and values provided.

        The stated endpoint in 2040 of 1560 MMt is 3x the 500 MMt level required and 8X the 200 MMt

        We have not explicitly addressed Non-PowerGen actions. Lacking anything specific, the best-case combination is 1560/5812 MMt, resulting in 7372 MMt in 2040.

        With these assumptions, the world total is 47Gt/year in 2040.

        What is new is that the EIA, presumably with EPA’s blessing, is now trying to shift the conversation from absolute CO2 reductions expressed in tonnes of CO2, to tonnes per unit of GDP.

        Whoa!!!

        “Tonnes per GDP” is, by definition, “Business as Usual” and an admission that the CPP will not get us to 2C/450ppm.

        Here is that redirect language along with some economic “mumbo jumbo” that says Real GDP will increase at 2.23% per year and that there will be an improvement of 1.8% per year in energy use per GDP.

        The OECD provides a GDP Forecast in its long term Economic Outlook 2009-2060. I have added the comparable values back to 2005 from World Bank Data to bridge the data from the historical to the forecast.

        Here is that data:

        • The key factor is the calculated MMt of CO2 per million dollars of GDP, 0.000492 in 2015.
        • There was a 10% reduction in this value for both the 2005-2010 and the 2010-2015 periods, based on the data and can be interpreted broadly as an improvement in overall efficiency of use.
        • The 1900GtCO2 in the 2C/450 ppm already consumed between 1870-2011, is included as the 2012 starting value in the cumulative calculation.

        The OECD GDP forecast is shown below along with the important scaling metrics.

        • The OECD GDP Forecast is shown without modification.
        • I assumed that same efficiency of use improvements, x0.90 for each 5-year increment, throughout the forecast period to 2060.
        • I added the scaled yearly increment based on this GDP Forecast data and underlying efficiency of use assumptions.
        • This efficiency of use assumptions are not likely to apply uniformly around the world, but that assumption is embedded in the calculation, nonetheless.
        • We bust the 2900Gt budget in 2041 and reach 3719Gt by 2060.
        • This is equivalent to 550-600 ppm and perhaps 4°C temperature rise.
        • If the 0.90 becomes 0.95, we bust the budget in 2038 and reach 4272Gt in 2060.
        • Annual release in 2040 becomes 55Gt and 69Gt in 2060.

        If the U.S., China and India all argue for CO2 tonnes/GDP, it makes sense, that this will become the world’s standard measure

        We have no chance at 2C/450ppm and it is important that we stop pretending that we are doing enough.

        We must also stop destroying the opportunity for Nuclear and CCS technologies with the underlying subsidies for natural gas power generation. We will need both of the targets to meet any kind of meaningful climate change targets.

        I have said this before, but it is worth repeating.

        If we all had the same “objective”, we would use the current lower cost of natural gas to offset the added cost of CCS, put CCS on Natural Gas Combined Cycle power plants, and in so doing, actually be on both the CCS learning curve and the 2C°/450ppm trajectory.