
The Clean Air Task Force published its “Impact of 45Q Federal Tax Credits” report in February 2019. The report was broadly characterized as “Carbon Capture & Storage in The United States Power Sector”.
The report summary offers that “45Q would lead to significant deployment of CCS, capturing and storing approximately 49 million metric tonnes of CO2 annually in 2030. It further states that “45Q could get us two-thirds of the way to the 2030 U.S. power sector goal, removing 49 million tonnes (0.049Gt), of CO2 from atmospheric release”.
Something did not compute. I could not reconcile this 45Q, 49 million tonne estimate, with the “two-thirds” of the 2030 U.S. 2°C Scenario (2DS) Power Sector Goal statement.
The 45Q tax Credit, as stated in the report:
“The 45Q tax credit for CCS first became effective in October 2008 and provided eligible corporations with an income tax liability reduction, the value of which depended on whether the captured CO2 was stored through EOR or stored in saline formations.
The value of the tax credits were $10 per tonne of CO2 for storage through EOR and $20 per tonne of CO2 for saline storage. These credit values continue to apply to projects that were placed in service before February 9, 2018, after which the expanded 45Q tax credit is applicable.
With the 2018 revision of 45Q, the tax credit for storage of CO2 through EOR and conversion of
captured CO2 into chemical products, increases from $10 to $35 per tonne of CO2. For storage in saline reservoirs, the tax credit increases from $20 to $50 per tonne of CO2. The tax credit value ramps up over ten years.
An International Energy Agency (IEA) assessment is cited, “to limit global temperature rise to below 2 degrees Celsius, U.S. power plants must remove 73.5 million tonnes of CO2 annually by 2030 through CCS. This power sector target rises steeply to 547 million tonnes of CO2 annually by 2050”. A caveat is offered that a policy pathway to fully meet the 2050 climate goal does not yet exist.”
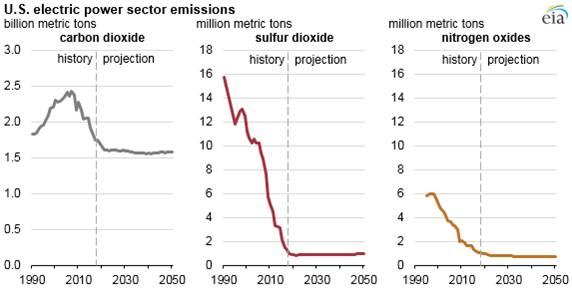
Just last month, I commented on this mostly flat projection for CO2 emissions stated to be 1,600 million tonnes for the U.S. Power Sector in 2050. The 49 million tonnes of CO2 would represent only 3% of the 1.6Gt.
I did a little digging and here is what I found in the IEA Energy Technology Perspectives (ETP) 2017, available for sale at https://www.iea.org/etp2017/:
“The 2°C Scenario (2DS) lays out an energy system pathway and a CO2 emissions trajectory consistent with at least a 50% chance of limiting the average global temperature increase to 2°C by 2100.
Annual energy-related CO2 emissions are reduced by 70% from today’s levels by 2060, with cumulative emissions of around 1170 gigatonnes of CO2 (GtCO2) between 2015 and 2100 (including industrial process emissions).
To stay within this range, CO2 emissions from fuel combustion and industrial processes must continue their decline after 2060, and carbon neutrality in the energy system must be reached before 2100.
The 2DS continues to be the ETP’s central climate mitigation scenario, recognizing that it represents a highly ambitious and challenging transformation of the global energy sector that relies on a substantially strengthened response compared with today’s efforts.”
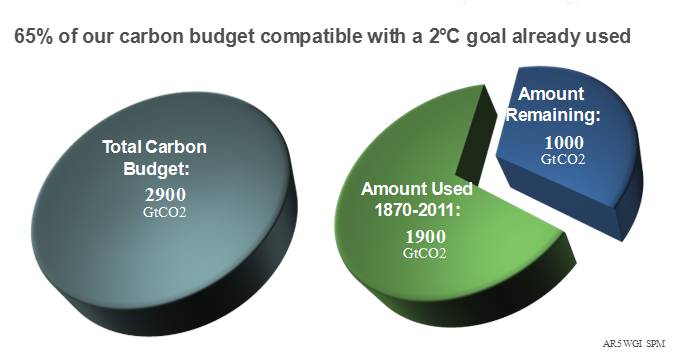
The ̴1170Gt estimate seems to comport with the magnitude of the IPCC AR5 “carbon budget” assessment, if not the timing. From the AR5:
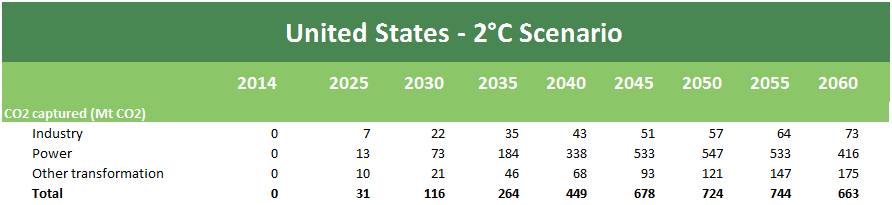
This is the data associated with the target 73.5 million tonnes of CO2 in 2030 to achieve the 2°C objective, where the 49 is, in fact “2/3 of the 73”. It’s the 73 that’s the problem.
There is not much difference between the cases on the TWh consumption. I wonder how this “no growth” TWh forecast can accommodate the “electrification” of our lifestyles that seems embedded in most scenarios.
And, what is not readily apparent is the seismic shift in power generation mix needed to support the 0.073Gt 2DS scenario target.
Take a look.
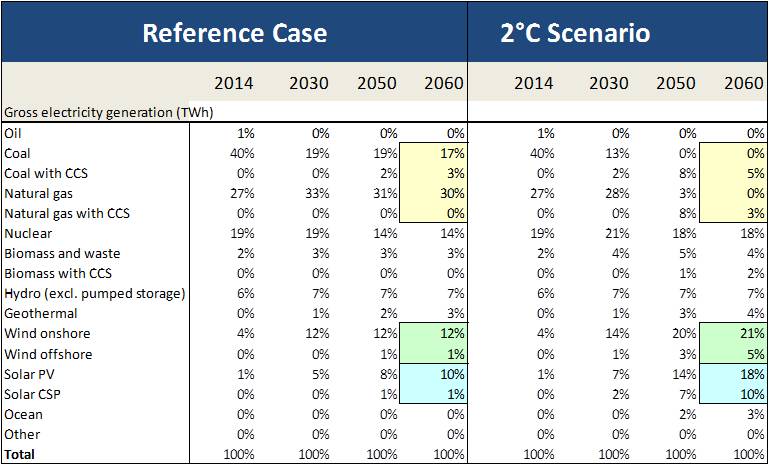
- The combination of coal and natural gas is 50% in the Reference Case moves to only 8% in the 2DS, and then, only with CCS.
- CO2 from Power Generation is virtually eliminated. This is the major reduction of CCS’s contribution and therefore, why the 0.049Gt represents such a large percent of the forecast.
- Total wind doubles from 13% to 26%.
- Solar more than doubles from 11% to 28%.
- Nuclear doesn’t go away, but maintains its 20% contribution.
- Hydro remains constant at 7%.
- Unabated natural gas continues to rise throughout the forecast period, peaks reaching ̴30% of the generating capacity by 2050 in the Reference Case, but declines to 3% in the 2°C case.
- Unabated coal is eliminated by 2030.
- Coal with CCS begins in 2025 and peaks in 2050 and declining to ̴25% of the reference case.
I now understand the numbers and the calculations.
What I don’t understand is why it takes so long to deploy CCS on both coal and natural gas??? The technologies exist. We need to get on the learning curve to drive costs down, not wait.
There is no reason to wait.